With markets falling sharply this week, the RRG-based scans that we track came up with very few results. This is to be expected when you’re looking for buying opportunities in markets that are generally trending lower. However, the good news is that the scans did not come back completely empty.
US – S&P 500 index
In the S&P 500 index, only three names surfaced. I requested all matches that occurred in the week 19-23 September.

Plotted on a Relative Rotation Graph (RRG), it gives us the picture below.
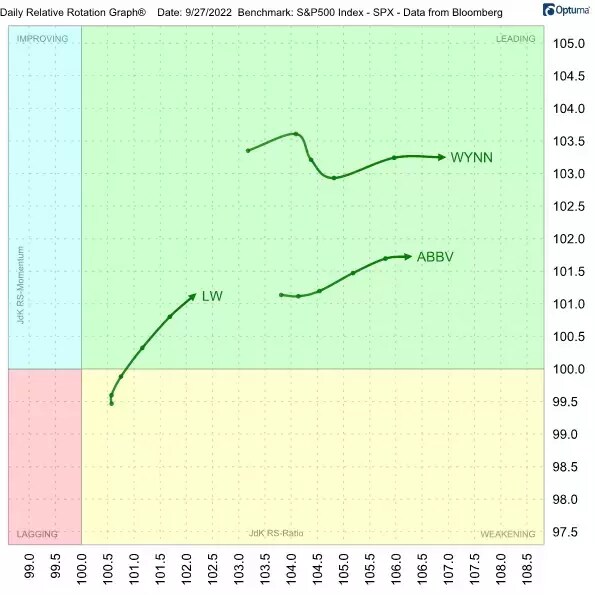
Out of these three candidates, ABBV and WYNN are showing what I’d describe as ‘reasonable’ charts.
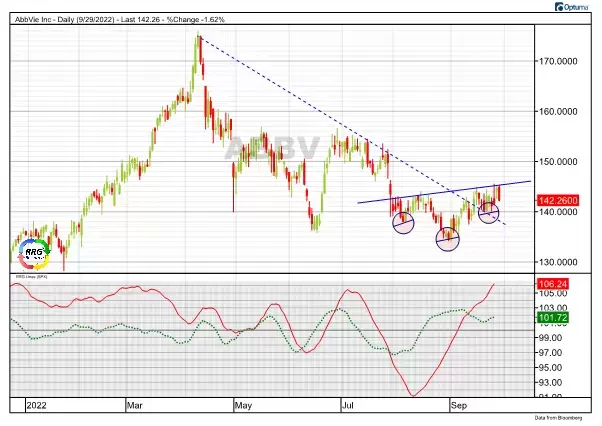
AbbVie seems to have ended its downtrend by breaking the falling resistance line over the peaks since March. Since July/August, an inverted head and shoulders (H&S) formation is being formed. In particular, the last rally out of the late August low has helped to push relative strength against the S&P 500 higher, and therefore push the tail of ABBV deeper into the leading quadrant on the RRG.
This week’s bounce off the neckline that marks the top of the H&S pattern, confirms the overhead resistance in that area. Only when the market is able to break above that neckline, currently around 145, should we anticipate more upside potential.
UK – FTSE 350
In the FTSE 350 universe there were a few more hits, as you can see in the table below.

The RRG for these symbols looks like this:
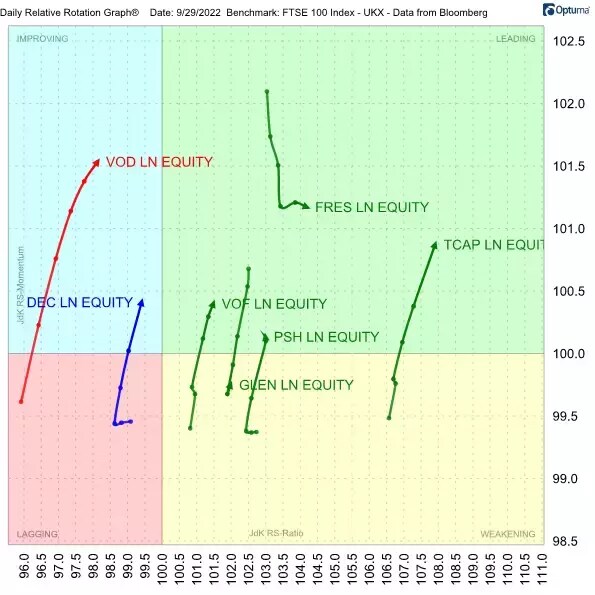
Going over the individual charts, I found three symbols that could have potential.
Fresnillo [FRES]
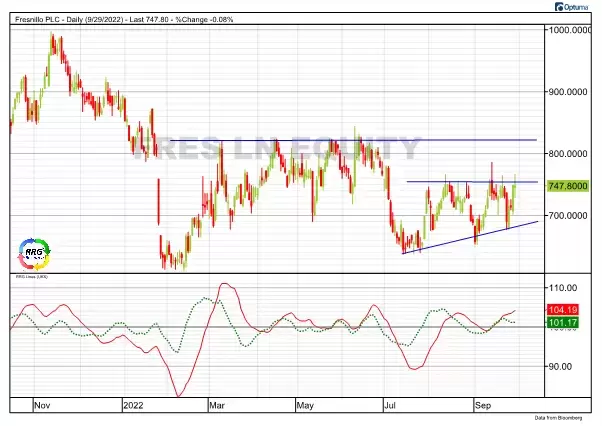
Fresnillo [FRES] has managed to stay above its July lows, and even put in two higher lows while all recent peaks were formed against 755, which is now a clear resistance area.
The relative trend (red JdK RS-Ratio line) is on the rise, and the green JdK RS-Momentum line is picking up strength again.
A break beyond that resistance area around 755 is likely to unlock more upside potential to the next zone, found near 820.
TP ICAP Group [TCAP]
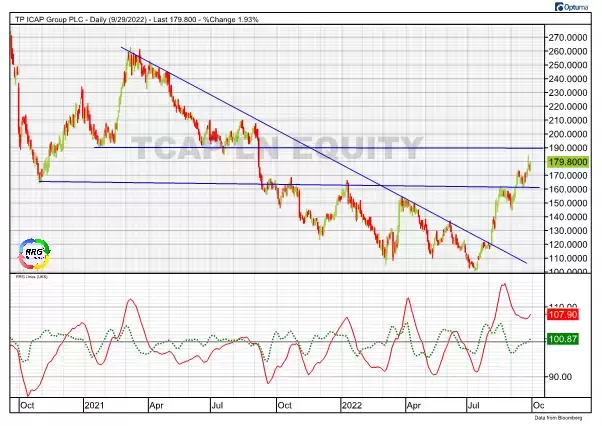
For TCAP, we need to look at a slightly longer chart to appreciate the recent movement. The rally out of the July low is clearly going against the general market trend, which is what is pushing the RS-Ratio line strongly above the 100-level.
The small pause when TCAP hit horizontal resistance around 160 caused the green RS-Momentum line to dip, and briefly move below 100. On the RRG this translates into a tail that rotates from the leading quadrant, into weakening, and then curls back up into leading again, without hitting the lagging quadrant.
We know that these moves are strong, as they represent the start of a new up-leg in an already rising relative trend. The current series of higher highs and higher lows is strong, and the action looks to be underway to a test of the next resistance area around 190.
Diversified Energy [DEC]
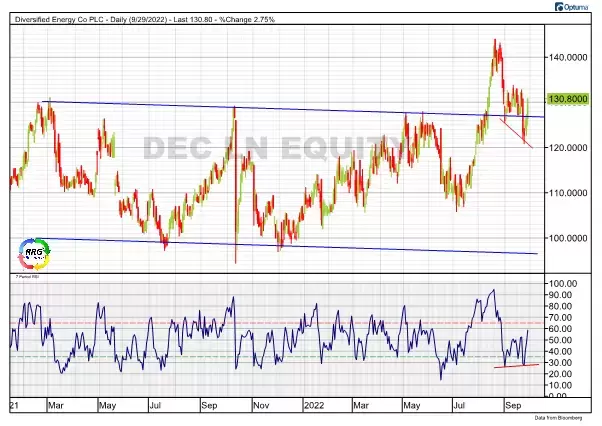
On the RRG we find the tail for DEC inside the improving quadrant, and travelling towards the leading quadrant at a strong RRG Heading.
Based on the position of the tail on the RRG compared to the other two names, DEC should have the best potential from a relative perspective, as it’s earlier in its move. But for that reason, it also holds the biggest risk.
DEC breached important overhead resistance back in August and rallied to a high just above 140, before dropping back and testing the old resistance area as support. The drop back into the range is usually a bad sign, but the aggressive buying that pushed DEC back above resistance has to be interpreted as strength, hence the rotating through improving and towards the leading quadrant.
Finally, the positive divergence between the relative strength index (RSI) and price over the last few weeks is supportive of a further rise, potentially back to the August highs.
Pricing is indicative. Past performance is not a reliable indicator of future results. RRG’s views and findings are their own and should not be relied upon as the basis of a trading or investment decision.
Disclaimer: CMC Markets is an execution-only service provider. The material (whether or not it states any opinions) is for general information purposes only, and does not take into account your personal circumstances or objectives. Nothing in this material is (or should be considered to be) financial, investment or other advice on which reliance should be placed. No opinion given in the material constitutes a recommendation by CMC Markets or the author that any particular investment, security, transaction or investment strategy is suitable for any specific person. The material has not been prepared in accordance with legal requirements designed to promote the independence of investment research. Although we are not specifically prevented from dealing before providing this material, we do not seek to take advantage of the material prior to its dissemination.


