


Global stock markets are all pointing to a negative close due to bond jitters and China’s economic turmoil in August, with the S&P 500 down 4%, the ASX 200 down 3.4%, and the Hang Seng Index slumping more than 8% month-to-date. The main theme is re-elevating inflation, jumping bond yields, and higher-for-longer rates indications from the Fed this month. Risk sentiment recovered somehow following the Jackson Hole Symposium as equities tried to rebound from the selloff in the past few weeks, despite the hawkish stance from the Fed and the ECB. This could have been a “sell the rumor, buy the news” moment, as central banks’ rhetoric was in line with expectations. And soft-landing” scenario may make investors believe that stock markets would be fine in a high-interest and high-bond-yield environment. Below are the technical indications of major indices for their near-term trends.
US SPX 500 (cash) – Uptrend is intact, while a head-shoulder top pattern surface
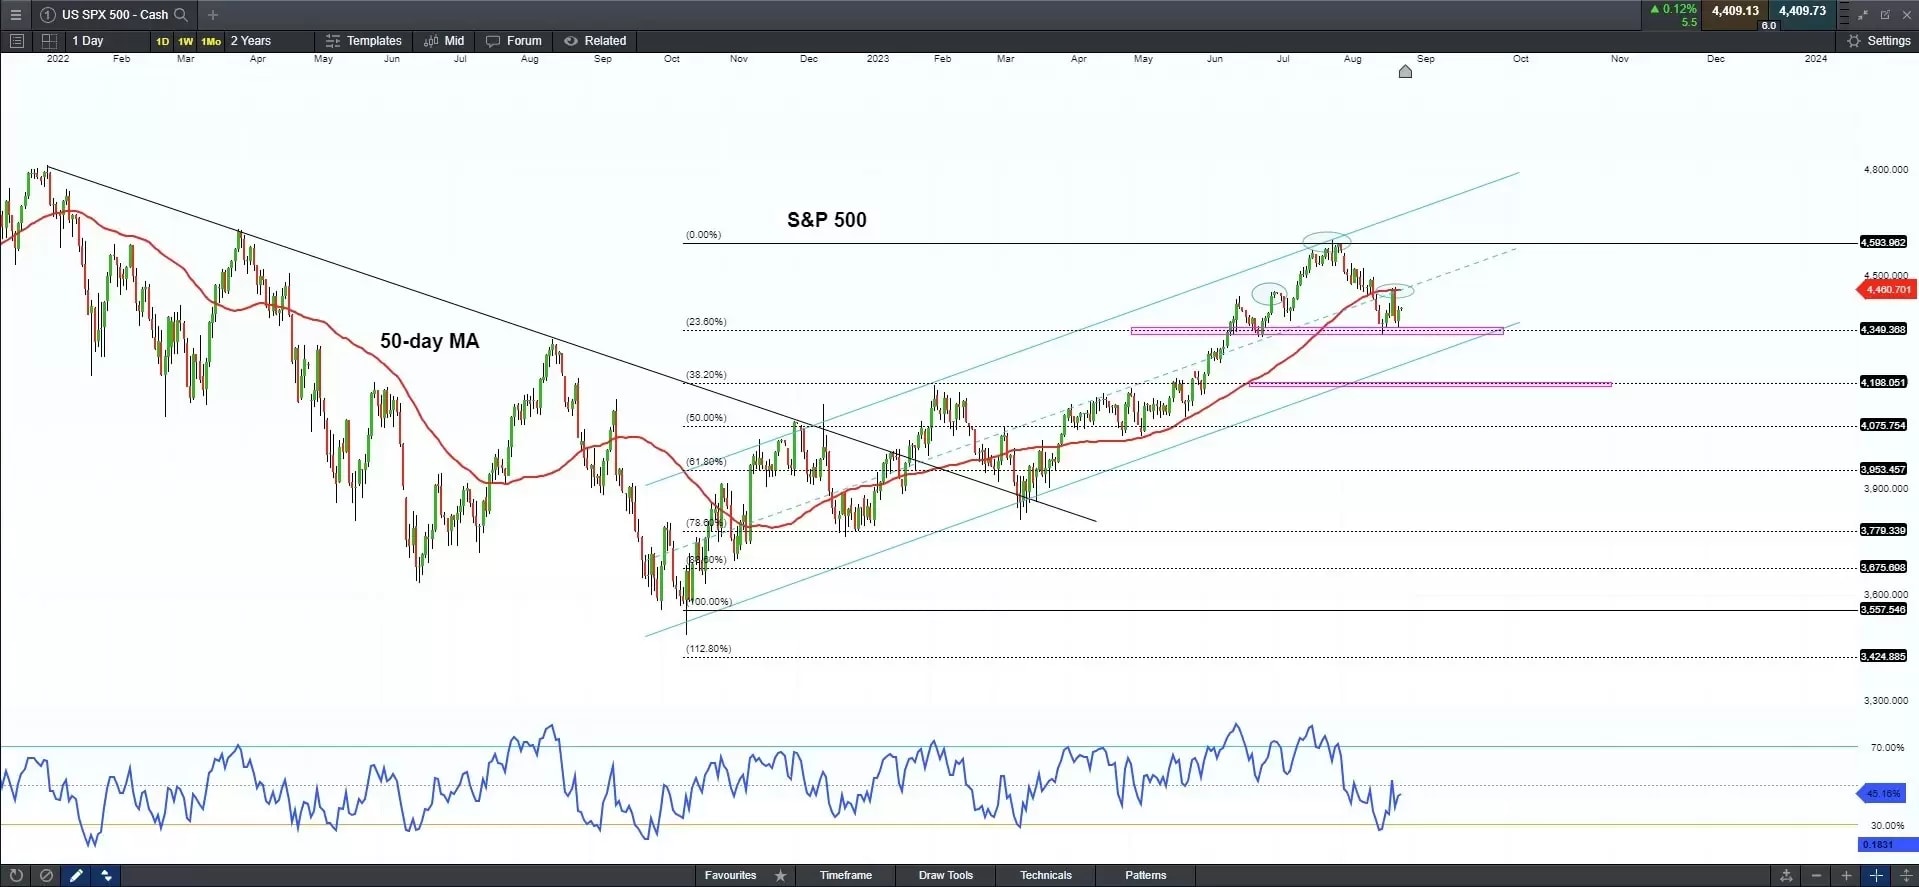
The S&P 500 has been moving within an ascending channel since October 2022 and retreated from the channel resistance, testing the imminent support of 4,350 at the 23.60% retracement of the Fibonacci. The notable pattern is a potential head-and-shoulder top (bearish), which may take the index to test further support of around 4,200 (38.20% Fib.) The near-term resistance can be at the 50-day moving average of about 4,460. At the same time, RSI rebounded from oversold territory, suggesting the potential neckline is a pivotal support level that determines its near-term movement.
Australia 200 (Cash) – Long-term uptrend is intact, testing pivotal support
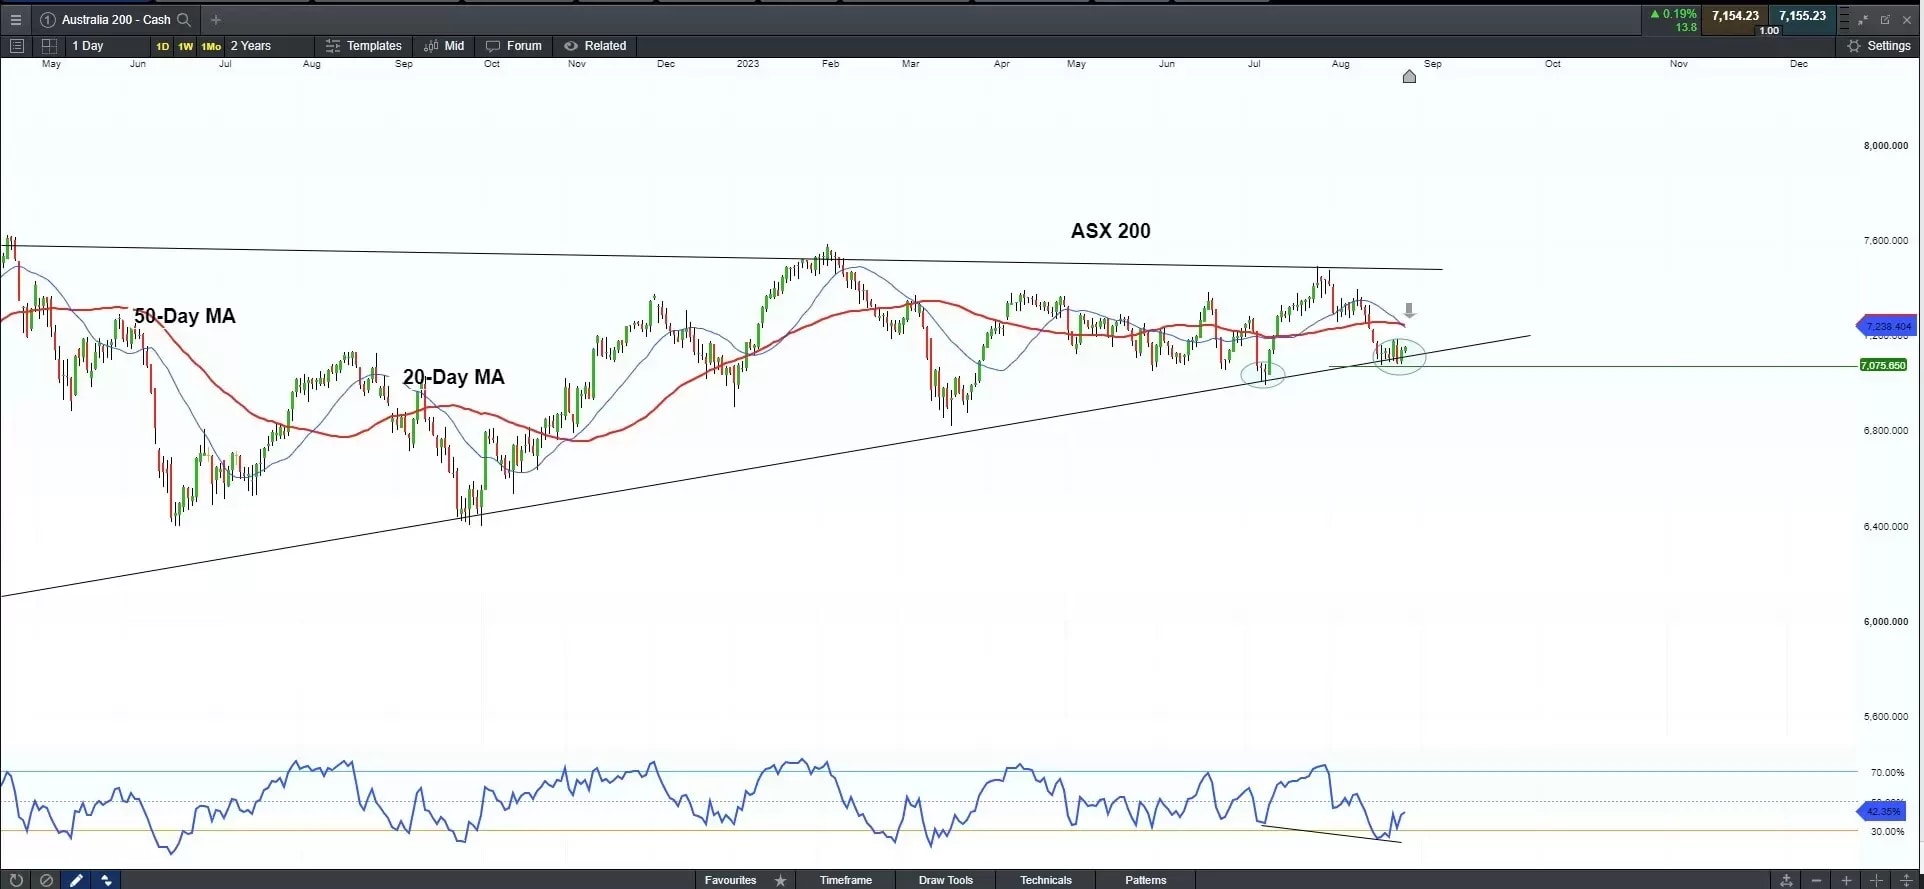
The ASX 200 has been moving in a long-term wedge pattern, consolidating above the trendline support of 7,080. The directional bias is skewed to the upside as RSI rebounded from oversold territory, and hidden bullish divergence may surface at such a pivotal support level. The near-term resistance can be found at about 7,200, which is the crossing of the 20-day moving average and the 50-day moving average. Due to the recent prevailing broad risk-off sentiment, the brewing short-term rebound will be in check, and a breakdown below the potential pivotal support of 7,080 may upend the index’s longer uptrend.
Hong Kong 50 (Cash) – Testing the double-top neckline resistance
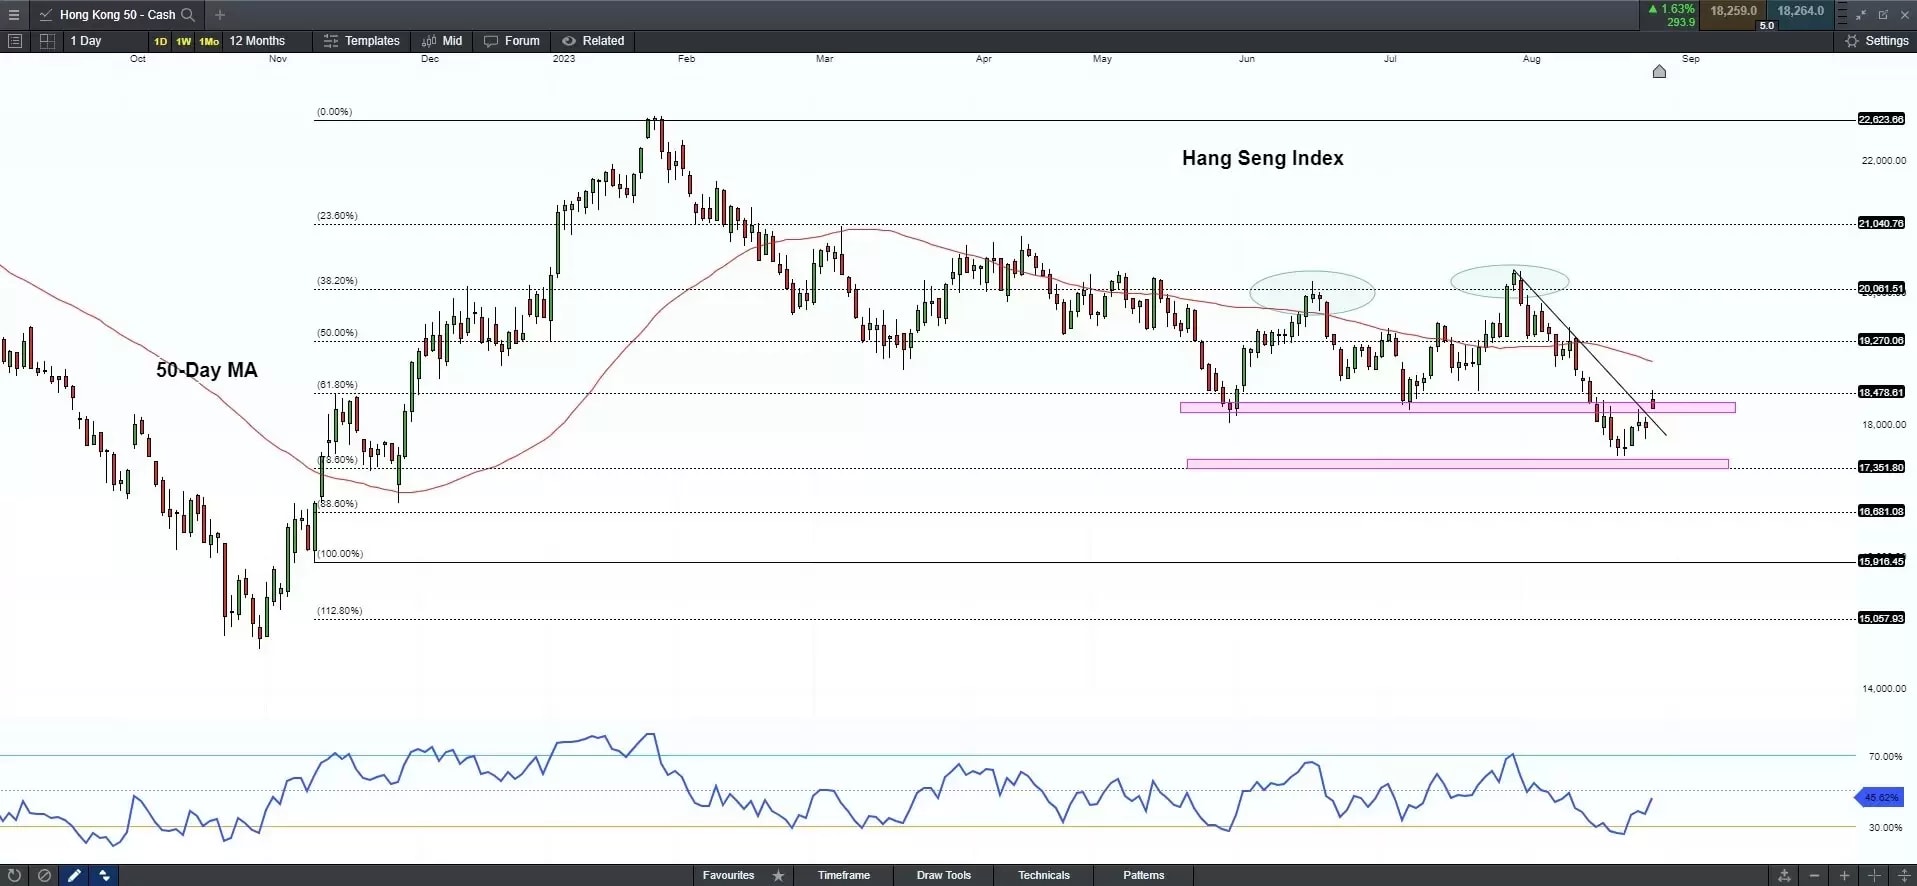
Hang Seng Index had a gap open on Monday, testing near-term resistance of 18,000. While the year-to-date downtrend is still intact, its double-top pattern may continue to pressure the index. A reversal trend will only happen if it bullishly breaks out the day-high level of about 18,500 on Monday. The bullish signal is an oversold movement in RSI, which could continue to support the near-term rebounding momentum. The index may head off further resistance of near 19,000 at the 50-day moving average if it can manage to break through the 18,500 hurdle. On the flip side, a breakdown below the pivotal support of 17,350 may pressure the index to slump further toward its low in November 2022, pricing around 16,800.
Disclaimer: CMC Markets is an execution-only service provider. The material (whether or not it states any opinions) is for general information purposes only, and does not take into account your personal circumstances or objectives. Nothing in this material is (or should be considered to be) financial, investment or other advice on which reliance should be placed. No opinion given in the material constitutes a recommendation by CMC Markets or the author that any particular investment, security, transaction or investment strategy is suitable for any specific person. The material has not been prepared in accordance with legal requirements designed to promote the independence of investment research. Although we are not specifically prevented from dealing before providing this material, we do not seek to take advantage of the material prior to its dissemination.

