Using trendlines in technical analysis
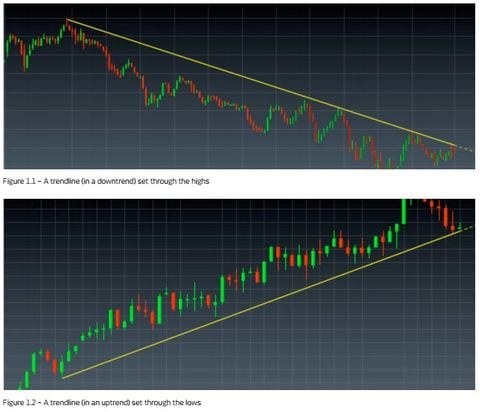
Trendlines are used in technical analysis to define an uptrend or downtrend. Traditionally, uptrend lines are made by drawing a straight line through a series of ascending higher troughs (lows).
A trendline could also be called a ‘trend support line’ because it shows the direction of a trend, and it acts as a support line.
With downtrends, trendlines are formed by drawing a straight line through a series of descending lower highs. The charts below are examples of down and up trendlines. It's usual practice to join the highs or lows (wicks) of the candlesticks and not the closing prices.
Uptrend and downtrend examples

Common trendline and channel rules
These two rules are usually applied to trendlines and channels:
- Declines in price that approach an uptrend line, or price rises that approach a downtrend line, can be good opportunities to initiate positions in the same direction as the trendline.
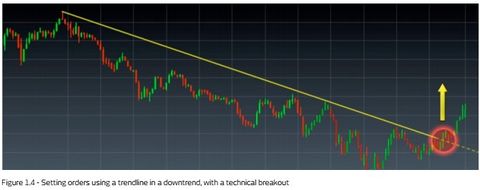
- The penetration of an uptrend line, particularly on a closing basis, is a sell signal, and the penetration of a downtrend line is a buy signal. Normally, analysts apply a minimum percentage price move (1% breach on a stock for example) through the line or a minimum price move.
According to the first rule, as price approaches an uptrend line, the trendline (if it's a valid one) tends to act as a support, so one could buy as price approaches the line. The line must not be breached. If a trendline is cut through, then we can say in effect that a support has been breached and we could act as we would if it were a normal support break.
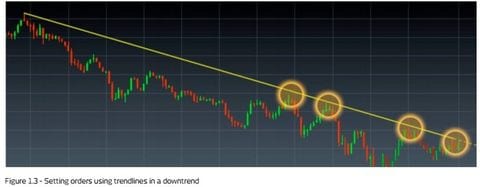
Conversely, downtrend lines tend to act as resistances. One could sell as the price approaches the line — again it must not be breached. In the chart immediately below, you will notice our entry points would be chosen with this in mind, providing 'cheaper' buy-in levels in an uptrend, nearer the trendline; and in a downtrend, providing higher levels to sell into a downtrend.

The 'sell' points in the above chart represent the ideal 'sell' orders, which would tend to cluster near and underneath a downtrend line. The reason they have to be underneath and not above, is that a downtrend line acts like a resistance line. Price action above the line would, by definition, be a 'technical break' over the line, which would mean a trader could expect a short-term spike, so could be looking to exit short trades rather than enter them.

In this chart, you can see an example of a downtrend and trendline for most of the chart, with the ideal selling points (shown by the trendline) throughout the course of the downtrend. Then, as all good trends do, the trend comes to an end with the break of the downtrend line and resultant short-term spike that follows.
Our charting features within the Next Generation trading platform enable you to draw your own trendlines. Find this capability in the drawing tools section of the chart function.
Redrawing trendlines
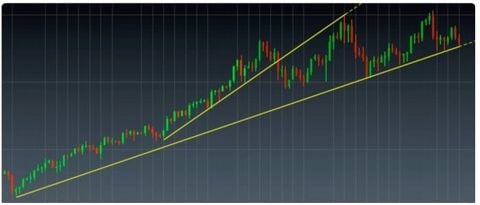
Changes in trend speed may necessitate the redrawing of lines. This is particularly important if they are breached temporarily, only to resume the trend, as this could make the lines themselves unreliable.

While penetrations of trendlines often warn of a trend reversal, a breach usually also means you will need to redraw a trendline, as shown by the chart above. It's not enough to show a trendline that works — it's important that the trend method also works.
CMC Markets is an execution-only service provider. The material (whether or not it states any opinions) is for general information purposes only, and does not take into account your personal circumstances or objectives. Nothing in this material is (or should be considered to be) financial, investment or other advice on which reliance should be placed. No opinion given in the material constitutes a recommendation by CMC Markets or the author that any particular investment, security, transaction or investment strategy is suitable for any specific person.