Support and resistance
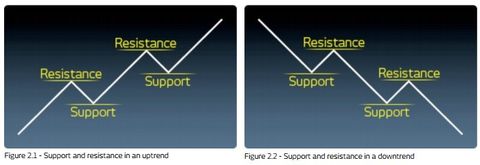
The troughs and peaks of trendlines are also known as support and resistance levels respectively. The identification of these levels represents one of the most important skills in technical analysis.
Support, as the name implies, indicates a price level or area on the chart under the current market price where buying interest is sufficiently strong enough to overcome selling pressure. As a result, a decline in price is halted and prices are turned back up again.
Resistance is the opposite of support. It represents a price level or area above the current market price where selling pressure may overcome buying pressure, causing the price to turn back down against an uptrend. It should be emphasised that an existing prior high does not imply that subsequent rallies will definitely fail at or below that high with pin-point accuracy, but rather that resistance could be anticipated in the general area.
Practical rules for finding support and resistance
Finding support and resistance involves determining what critical prices define the trend (or range) and are more important over and above other prices. There are guides and rules for determining the legitimacy and strength of a price level, irrespective of whether it is a support or resistance. These include:
- Times tested: where a price level has been ‘tested’ (traded) at or near, several times, it may be remembered by participants. For example, traders may not sell into a low or trough if past experience has shown this is not wise.
- Volume spent: following on from the above point, if large amounts of volume have been transacted at or near a certain level, this also tends to be considered and noted by participants in the market.
- Recent trading: the more recent the trading at a certain level, the more relevant the level is to an analysis of market price.
- Round numbers: for reasons more to do with psychology than anything else, traders (and people in general) tend to remember ‘round numbers’.
Trading strategies using support and resistance
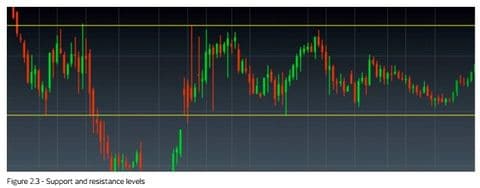
One of the best uses of support and resistance is for entry and exit of positions coupled with efficient risk management setting. Some of the practical uses include:
- Take profit. This is the price at which one takes the profit available on a position. That is, as the price approaches a support (from above), short sellers may take profits on their positions. Conversely, as price approaches a resistance (from below), long traders may take profits.
- Establish a new position near an unbroken level. When the price approaches the support level, a technically driven investor would tend to pitch limit buy orders near and above a defined support and, conversely, would pitch limit sell orders near and just under resistance levels.
- Establish a new position on the break of a level. When a support breaks, one can initiate a short position on the technical expectation that prices will then go onto the next (lower) support level. Conversely, if a resistance breaks, one could buy on the expectation that prices will move on to the next (higher) resistance, if there is one.
- Stop-loss setting. A breach of a level can be used to limit loss too. Rather than using a break of a support or resistance level as an opportunity to establish a new position, you can also use it to minimise loss. A losing position should be immediately exited. The signal to do so comes from the breach of the support or resistance level.
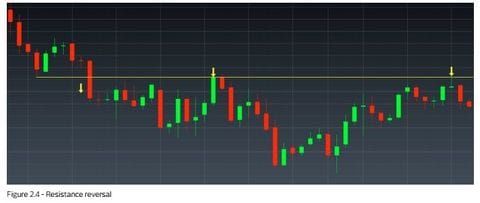
Once broken, support and resistance levels reverse roles. This is a key aspect of support and resistance identification: once a level (whether support or resistance) is broken, the technical characteristic of the level is reversed. That is, a broken support now becomes a resistance and a broken resistance now becomes a support. This can be seen in figure 2.4.
Learn more about support and resistance breakouts in the stock market.
Technical analysis in ranges
One of the most useful technical patterns is a sideways trend, or range. It allows a simple, mechanical strategy to be followed as detailed below.
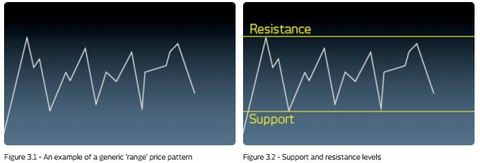
The first step is to identify the support and resistance that bound the current and recently observed price action. Once this is done, the theory is to pitch the buy and sell orders appropriately, near and above the support and near and just under resistance levels respectively. After this is done, it is prudent practice to apply stop losses (for example exit orders) to the buy (or sell) orders.
An example:
A basic example of a trade plan, with a planned limited risk (for instance the difference between our orders and the exit), for a hoped for return. There are two possible scenarios that may follow on from this plan:
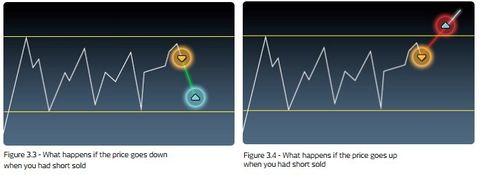
If the trade plan outlined in figure 3.2 is used and a sell position is entered into, one of two events will occur. They are outlined in figures 3.3 and 3.4. Figure 3.3 shows the ideal scenario. A short (sell) position was entered into at the top of the range, near the high and resistance level, with a stop loss on the other side of resistance.
From the selling point, the price falls back to the lower end of the range and the take profit order (near support) is triggered and the position is exited with a profit.
Figure 3.4 shows the scenario to avoid, but that you must be prepared for. A short (sell) position was entered at the top of the range, near the high and resistance level, with a stop loss on the other side of resistance. From the selling point, the price rises back to, and through, the upper end of the range, instead of falling. In doing so, it hits and triggers the stop loss. This position is therefore exited with a loss. Note: please be aware that this is a very basic outline of a possible trading plan. You should never stop learning and practicing in this area.
- This is a theoretical example of a trade plan, driven by identification of support and resistance
- The application of buy and sell orders based on point 1)
- The application of stop loss measures to limit risk and safeguard performance. Below, the schematic method shown in figures 3.3 and 3.4 has been applied to a practical (but historic) trading plan and market
Sketching out the plan: a practical example
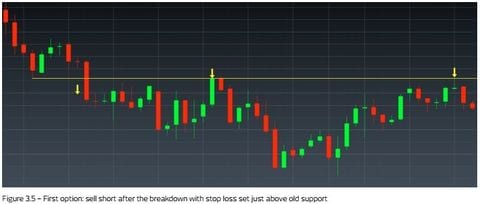
In this example a support has been broken and the price has dropped much lower. Over time the price action has recovered to just below the old support, which is now expected to have reversed, to become a resistance level.
There are two options. The first is to short sell just below the resistance with a stop loss on the other side anticipating a drop in price. The second is to wait to see if there could be a technical breakout (where the price breaks the resistance) and a buy order can be entered just above the breach with a stop loss slightly below the old resistance (now expected to act as support).
Some additional key patterns to look out for:
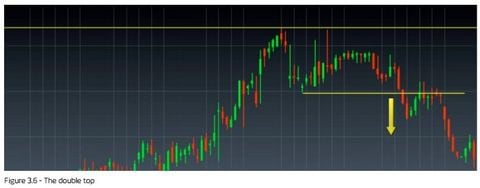
The pattern in figure 3.6 is known as a ‘double top’. It is a range pattern, where there are two distinct tests of resistance, which are then followed by a fall in price back down to the support level of the defined range, which is then breached. Note that the name of the pattern is not as important as the fact that a key identified level (in this case a support) was cut, or breached. There are elaborations of such patterns. If, for instance, there were three distinct tests of the topside (or resistance), followed by a price fall that actually breaks the support of the range, this would be called a ‘triple top’.
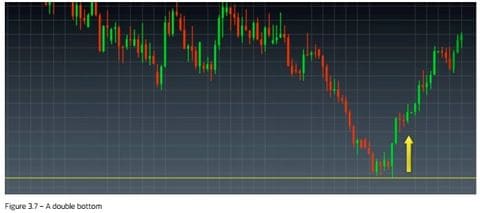
A pattern is ‘confirmed’ once the support or resistance levels are broken. Otherwise it is only a probable or provisional pattern.
CMC Markets is an execution-only service provider. The material (whether or not it states any opinions) is for general information purposes only, and does not take into account your personal circumstances or objectives. Nothing in this material is (or should be considered to be) financial, investment or other advice on which reliance should be placed. No opinion given in the material constitutes a recommendation by CMC Markets or the author that any particular investment, security, transaction or investment strategy is suitable for any specific person.