Autochartist for MT4
What is Autochartist?
Autochartist is a powerful technical analysis tool that can support your MT4 trading. Get it free when you open an account with CMC Markets.
Already a CMC trader?
Popular chart patterns
Whether you're looking for channels, wedges, triangles, flags or other popular chart patterns, the inbuilt scanner tools help to identify statistically significant market movements for you, sending updates automatically.
Key support & resistance levels
Let the scanner find and alert you to key support and resistance levels that can help you identify possible entry and exit points.
Fibonacci patterns
Learning how to identify Fibonacci retracements, extensions, ABCD patterns, Butterfly and Gartley patterns just got a lot easier with built-in Fibonacci scans.
Volatility analysis
Get statistical analysis of volatility over the last six months for specific instrument and time intervals, to guide potential trading opportunities for stop-loss and take-profit levels.
Alert notifications
Like any trade opportunity, timely updates are important to perfecting any strategy. Never miss a trading opportunity with real-time alerts, 24 hours a day.
Fully customisable
Filter the scanner parameters to receive pattern types and key levels specific to your trading strategy.
How it works
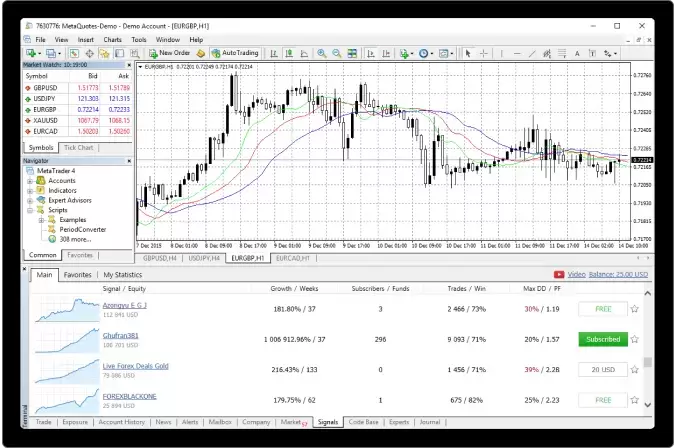
Autochartist's unique pattern recognition software continuously scans the markets to highlight thousands of trade ideas each month, saving you valuable time analysing your favourite instruments.
Receive alerts when the scanner identifies emerging or completed patterns on your preferred instruments and pattern types, providing real-time trading opportunities.
How to use Autochartist
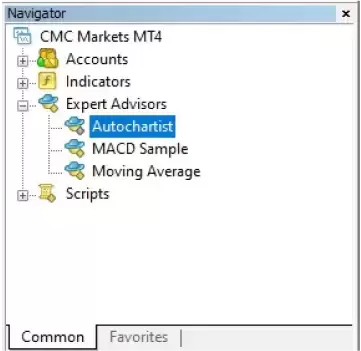
Firstly, you need to open a CMC Markets MT4 trading account. Once you have logged into the MT4 platform, find the Autochartist tools within the navigator window. Select the Expert Advisors option within this window. Drag and drop the desired tool on to the chart. The advisor window will appear and be ready to use.
Identify trading patterns
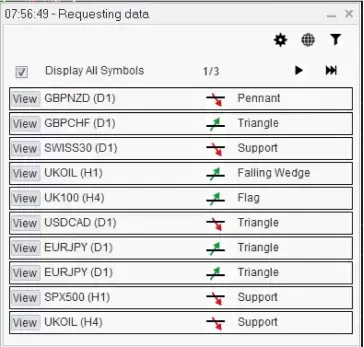
The main window will appear in the bottom right of your chart, displaying a list of symbols with emerging and completed patterns. This window is fully customizable, allowing you to filter the types of patterns including common patterns, Fibonacci, support and resistance, display patterns across various long- and short-term intervals and indicate the number of historical patterns to be shown. This flexibility allows you to be alerted to the most relevant trading opportunities and then backtest them against historical patterns.
Details window
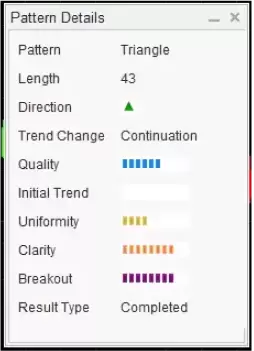
When you open a pattern on to your chart, a details window will appear in the top right with further information, including the type of pattern displayed, the length and direction of the pattern and if it’s emerging or completed. This detail screen will also display a range of handy trend characteristics such as quality, uniformity and clarity.
